How to Audit Your Audience Data: A 5-Step Guide for Venues

Why most audience data dashboards stop being useful

If you're responsible for audience reporting at an arts venue, museum or gallery, your dashboard or spreadsheet has probably grown bit by bit. Maybe someone added a metric when a funder asked. Another was included when a board member wanted visibility. More followed each time a new platform came in.

The result is an audience data dashboard that takes an afternoon to update and doesn’t actually tell you what to do next.

This guide walks you through a five-step audit. It's for cultural organisations who want to take a more data-driven approach: cutting the metrics that don't drive decisions and replacing them with ones that do.

Step 1: List every metric you currently track

Pull together every recurring report that your team has produced in the last six months, whether that’s for the board, internal, for a specific department or funder. Strip out the commentary and list every metric in one place. Note its source, who looks after it, and how often you report it.

Don't filter or judge it yet: the audit only works if every data point sits on the same list first.

If your data lives across a ticketing system, email platform and CRM, the inventory itself can take longer than the audit. Platforms like Ticketsolve bring ticketing, CRM, marketing and reporting onto one system, which speeds this step up considerably - but the principle is the same whatever your tech stack.

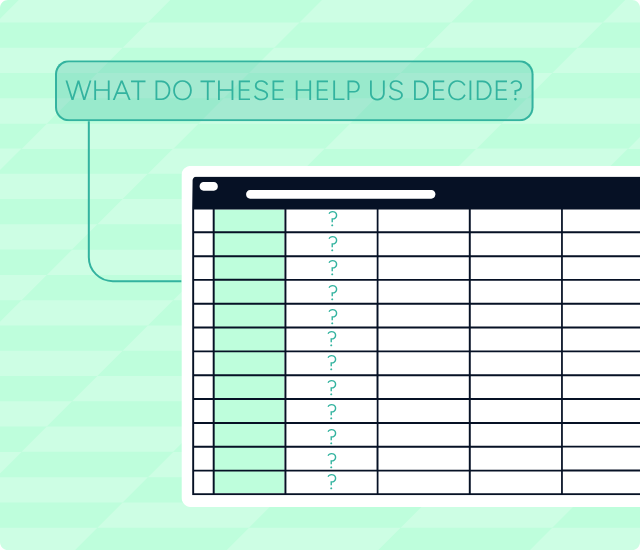
Step 2: For each metric, ask what it helps you decide

Take a metric most venues track: email open rate. If it dropped by 10% next week, what would you do?  

If the answer is "review the subject line and re-assess our newsletter list segments", the metric earns its place. If the answer is "note it in the next report and move on", it doesn't.

If you can't finish the sentence, flag it. The metric might still be interesting, but it isn't helping anyone make a decision.

Try the same question on the data points you report upward. Ask a board member or funder what decision a particular metric helps them make. If they can't answer, that's your evidence to change it.

This question is the simplest way to answer the bigger one: what metrics should venues track? The ones that pass this test stay. The ones that don't go.

Want to learn more about our platform?

Step 3: Separate funder reporting from operational metrics

Split the flagged metrics into two columns: ones you're required to report (by funders, the board, or a contract), and ones that are only there out of habit.

Be careful. Some metrics that you assume are required - aren't. Some that you assume are optional are explicit funder or local authority asks.

To work out which is which, go back to the source documents rather than relying on memory or precedent. For each metric, check: your current funding agreements and grant conditions, the most recent reporting templates from your major funders (Arts Council, local authority, trusts), your board's agreed reporting framework, and any contractual obligations with partners or co-producers. If a metric isn't named in any of those, it's a habit, not a requirement - even if you've been tracking it for years.

It's worth doing this check annually, as funder requirements change and metrics that were once mandated quietly drop off the list.

For example, total annual attendance is almost always a required figure for Arts Council, local authority or trust reporting, so it stays in your dashboard whether or not it changes a decision week to week. A metric like newsletter sign-ups by source, on the other hand, is often tracked out of habit - but it should be earning its keep operationally, telling you where to focus acquisition spend next quarter.

Keep them visually separate - same data, different pots. 

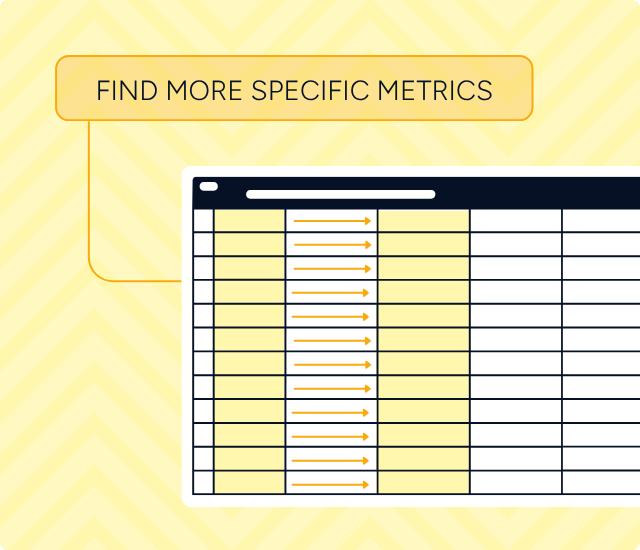
Step 4: Replace weak metrics with more specific ones

For each metric that fails the decision test, propose a version that links more clearly to outcome:

Simply by sharpening the focus of your KPIs, you can shift your reporting from describing activity to guiding decisions.

  • Total website visits → conversion rate on programme or What's On pages
  • Total email subscribers → revenue or visits attributed to email
  • Total footfall → visit-to-engagement rate (talks attended, tours taken, secondary spend)
  • Total tickets or visitors → broken down by programme, segment or campaign source

Removing without replacing makes people feel they're losing visibility.  We suggest leading with the upgrade: for one reporting cycle, show both side by side. The new metric will speak for itself once stakeholders see it work.

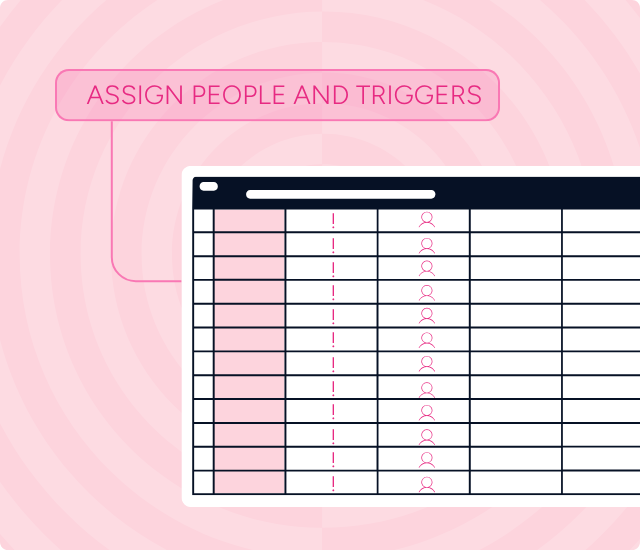
Step 5: Give every metric a person and a trigger

A metric without a named owner drifts - just as a metric without a clear "if this, then that" sits in a report and nothing happens.

For each one you're keeping, write: "If [metric] reaches [level] by [date], [role] will [action]." Vague triggers don't result in action. 

If a metric has a clear use but no one is watching it, that's not a reason to retire it - instead, assign it to someone who can keep an eye on it.

FAQ Embed – Ticketsolve

Frequently asked questions


Going further

The full whitepaper goes more in depth, offering a four-part definition of an actionable metric, tools to help your pair metrics and a template to help with defining hypothesis led KPIs.

Quote icon

Let's start something brilliant together

We’d love to show you how we can help you thrive.

No items found.

Download the Whitepaper

Download now